Welcome to the Barley Pangenome Visualisation Suite
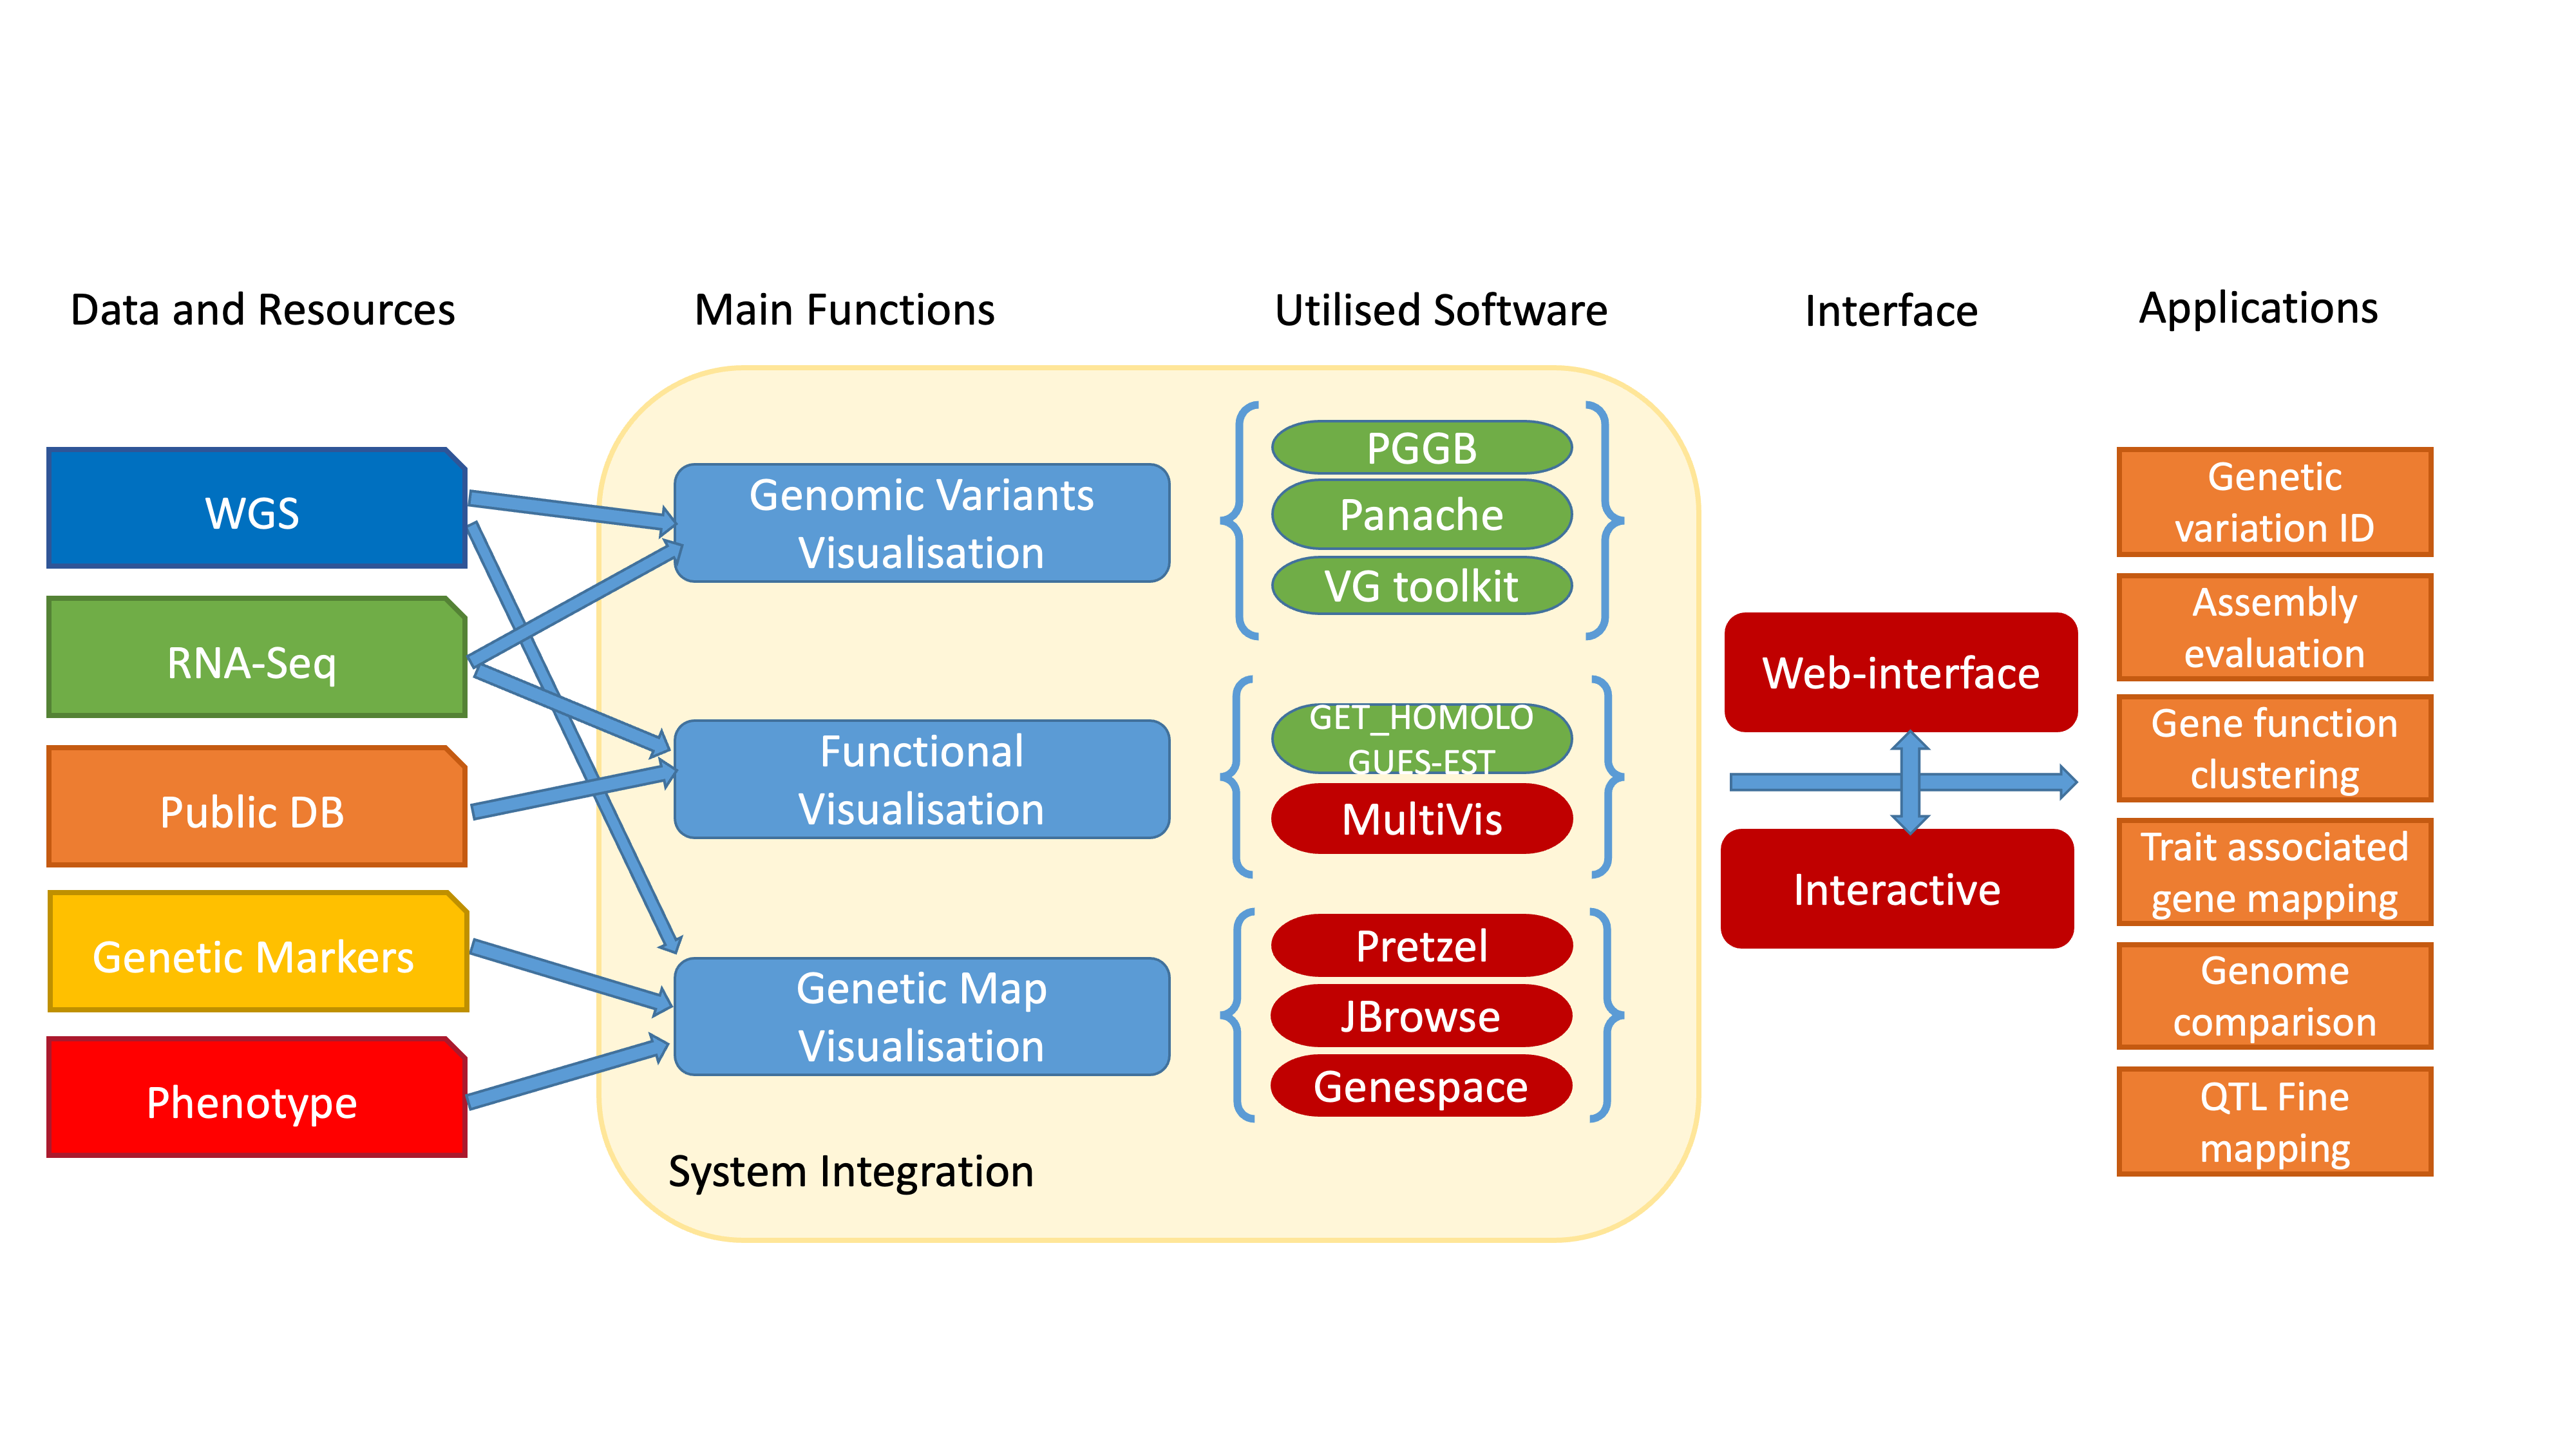
The Barley Pangenome Visualisation Suite consists of multiple different exploratory and visualisation resources. These include:
- Pretzel - A multi-dimensional pangenome browser. Visualise QTL, SNP/INDEL and genes across the pangenome.
- Barley Panache - PAV pangenome browser, allowing for visualisation of PAV across the pangenome.
- JBrowse - Linear genome browser of each genome from the pangenome, including multiple tracks from genes, RNA-seq and variant calls.
- Genome graph - Visualisation of the pangenome graphs with embedded large SV to small base-pair level variation.
- Clustering - Gene cluster analysis and visualisation of CNV/PAV, with assigned functional groups.
- Synteny - Pangenome-wide Syntenic analysis and visualisation using Genespace.
Pretzel
A multi-dimensional pangenome browser, with gene, SNP/InDel, and QTL tracks.
Barley Panache
A PAV pangenome browser, allowing for visualisation of PAV across the pangenome.
JBrowse
Genome browser for each genome.
Pangenome graph
Visualisation of the barley pangenome graph with inversions.
Gene cluster analysis
Interactive and static visualisations depicting pangenome orthologous gene clustering, identifying CNV/PAV with functional annotation.
Pangenome-wide Syntenic analysis
Visualisation of synteny across the pangenome.